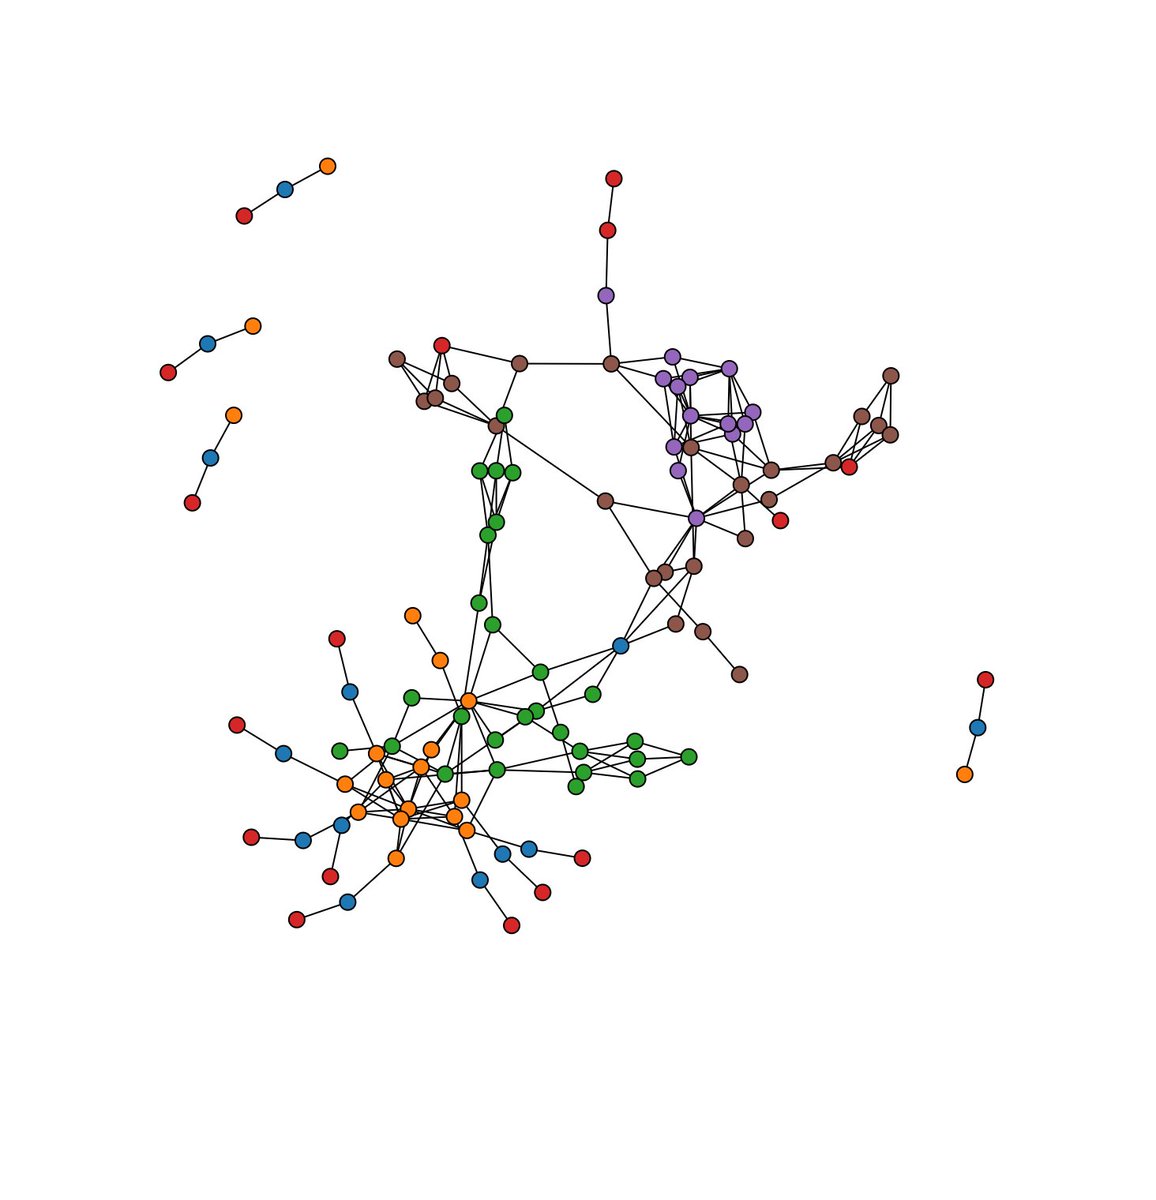
Python is a versatile programming language that is widely used for econometrics, statistics, and data analysis. pyoflife.com/introduction-t…
#DataScience #pythonprogramming #DataScientists #dataAnalysts #EconTwitter #statistics #econometrics #dataviz


In the world of programming, elegance isn’t just about aesthetics; it’s about efficiency, maintainability, and clarity. pyoflife.com/clean-python-e…
#DataScience #pythonprogramming #DataScientist #DataAnalytics #dataviz #webdev #statistics


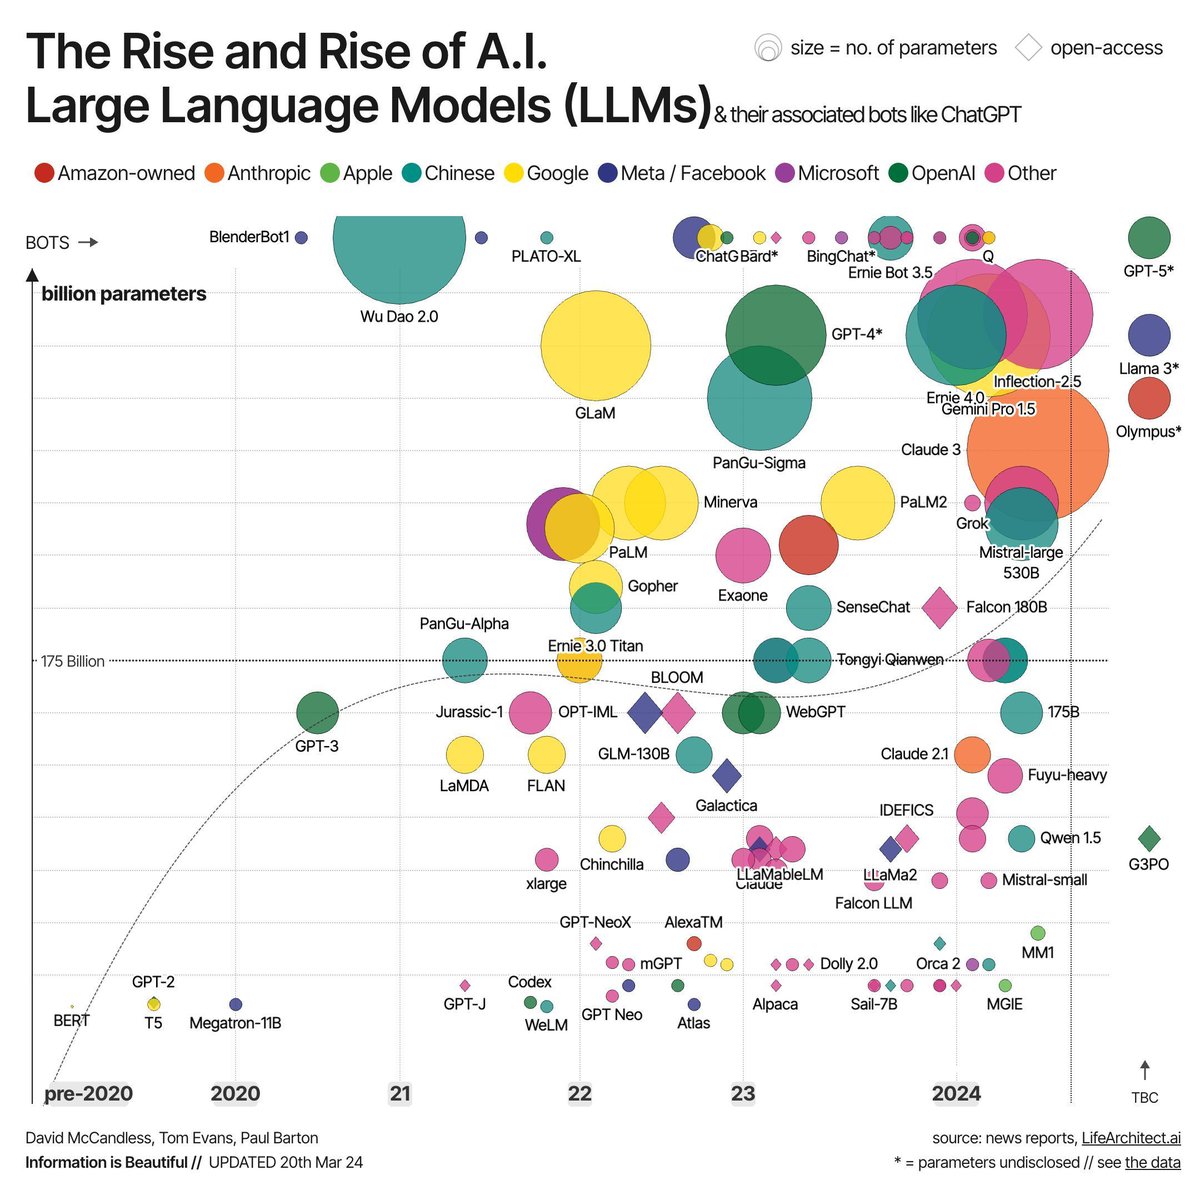
#LLMs Landscape, With Their Associated #Bots (such as #ChatGPT )
bit.ly/44T7IS9 v/ Information is Beautiful
#AI #GenAI #GPT #DataScience #DataViz
Dev Khanna Eveline Ruehlin 💙 #TechForGood 💙 Dr Stephen Harwood #SDG #DEI #Tech4Good #AI🇺🇦 Diane Kaneza Sergio_Raguso 🌐 Shane Fogle Eric Gaubert Dr. Marcell Vollmer 🇺🇦 #StaySafe #CES2024 #MWC24 Dr Efi Pylarinou Antonio Vieira Santos…


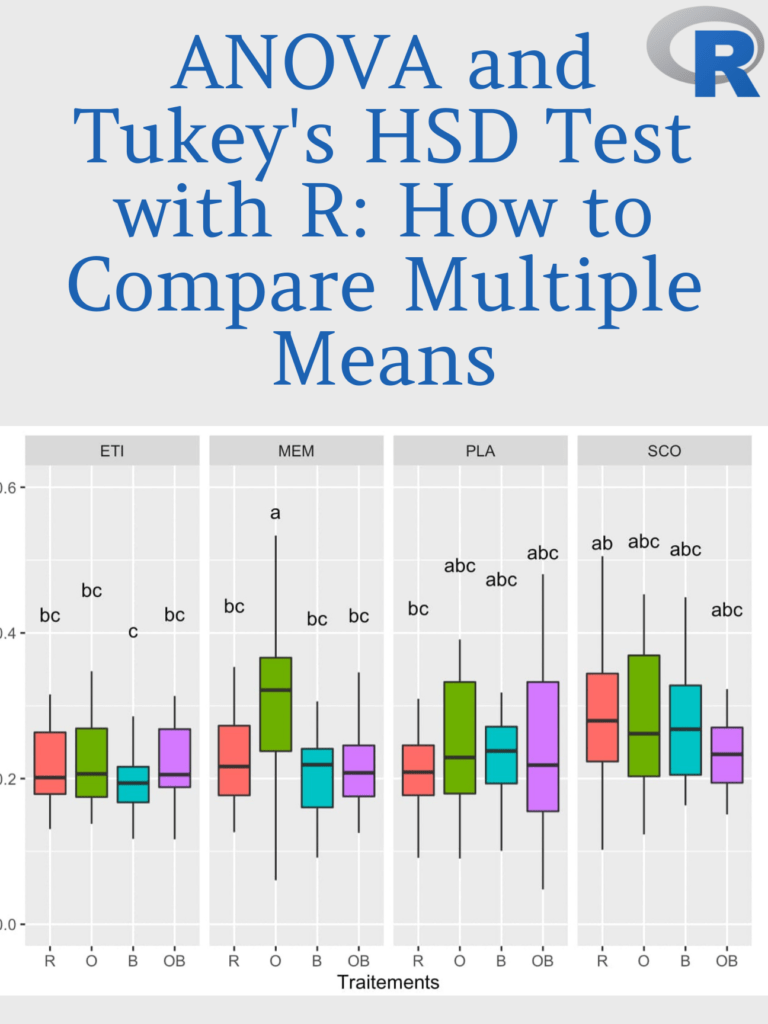
When conducting statistical analysis, it is often necessary to compare multiple means to determine if they are statistically significant. pyoflife.com/anova-and-tuke…
#DataScience #r stats #DataScientist #dataAnalysts #r #programming #dataviz #Database #coding

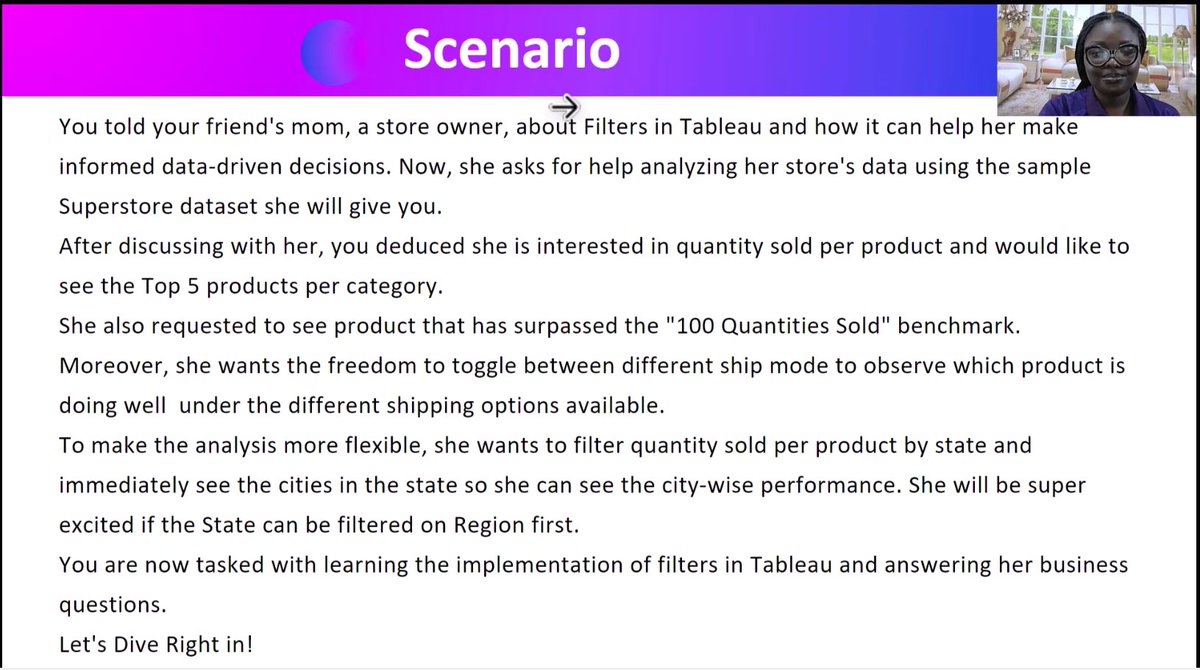
Ever tried scenario-based teaching?
I recently incorporated it using Filters in Tableau , and my students loved it!
It immerses them in a virtual reality where they act as active data analysts.
What are your thoughts on it?
#Datafam #DataViz #DataAnalyst #DAInstructor


Tired of Data Drowning You in Numbers? Dive into Data Visualization! ( #DataViz #Communication #DataScience )
Data got you feeling lost at sea? DataMinds.Services' AI³ Training and Upskilling Initiative presents 'The Power of Data Visualization: Communicating Insights…

💻 Power BI Datamarts - Power of Azure SQL Database
🔗 medium.com/microsoft-powe…
For more: linktr.ee/powerbi.master…
#PowerBiMasterclass #PowerBI #DataVisualization #dataviz #DataAnalytics #DataScience #BusinessIntelligence


#NileRiver = life! 🤯 This map proves it! 🇪🇬🇸🇩🇸🇸🇪🇹🇺🇬 People flock to its banks like bees to honey! 🐝🍯
Inspired by Milos Makes Maps
#30DayChartChallenge #Africa #DataViz


Data science and analytics have witnessed a transformative journey with the evolution of programming languages. pyoflife.com/advanced-r-sol…
#DataScience #r stats #DataScientists #dataAnalysts #statistics #mathematics #r #programming #dataviz #statisticalanalysis #MachineLearning

I can't give you the world, but I can give you a beautiful, an interactive and insightful visualizations.
#DataScience #DataAnalytics #DataViz #TechForGood #Datavisualization #Powerbi #MSPowerbi


📌📄Multivariate techniques allow researchers to explore complex relationships within data sets and identify underlying patterns or structures. pyoflife.com/using-r-with-m…
#DataScience #r stats #DataScientists #dataAnalysts #statistics #MachineLearning #r #programming #dataviz


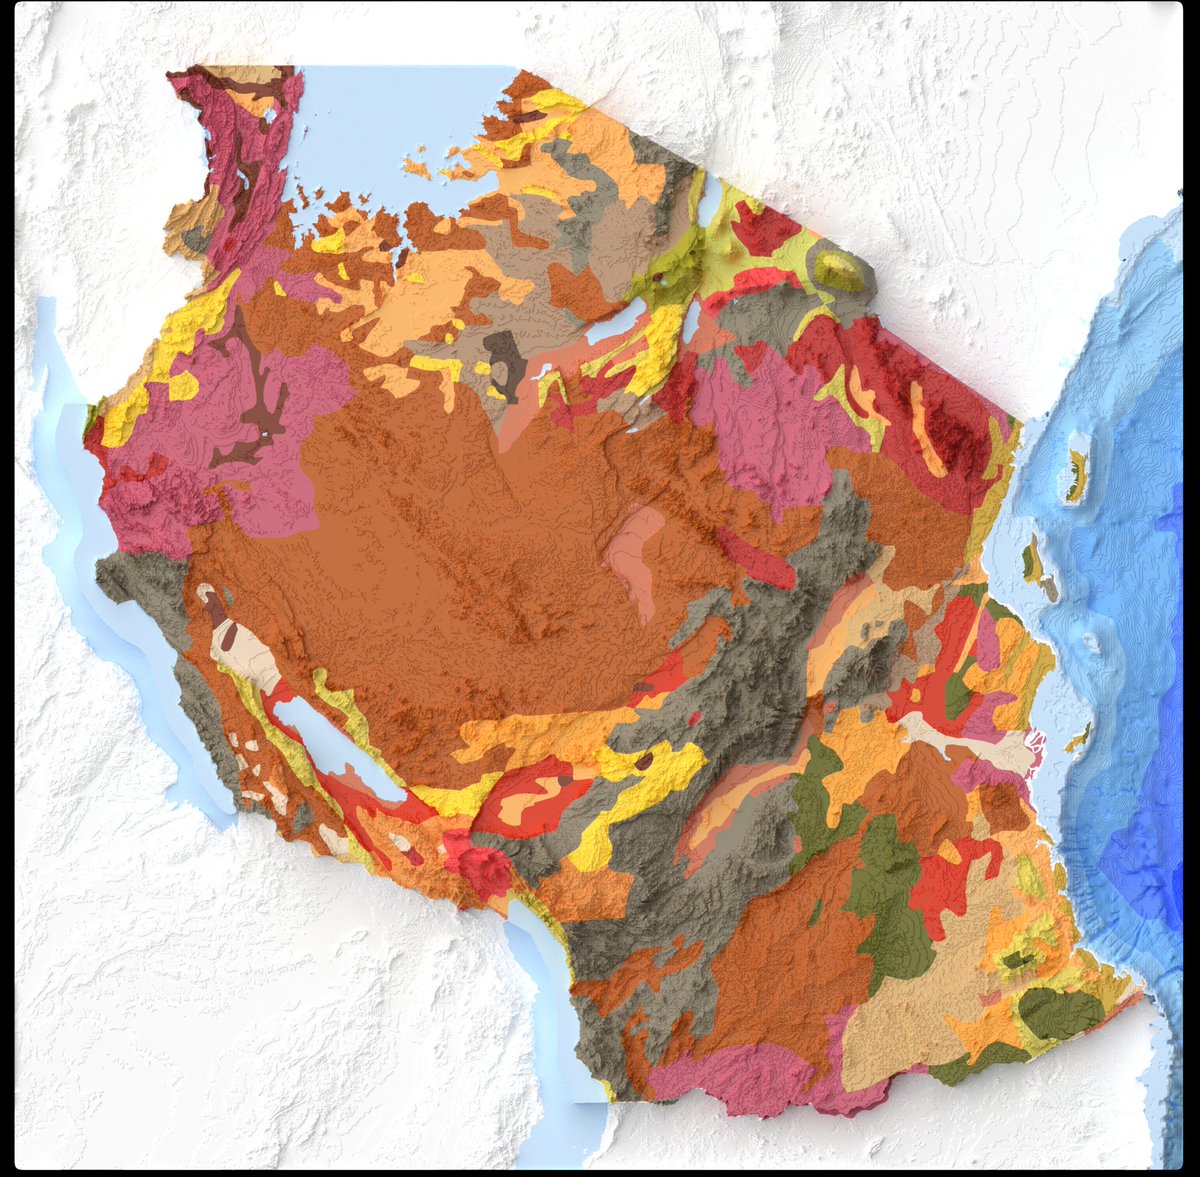
A Map🗺️ Showing Soil Texture Types of Africa Continent, Dataset is from (Hengl,T.,MacMillan,R.A,.2019) #Africa #EastAfrica #WestAfrica #SouthAfrica #NorthAfrica #Soil #geology #map #dataviz #gischat #geospatial #dataviz #qgis #b3d #Blender


💫💥 Visualización de datos genómicos en #rstats (código disponible) 🤩
buff.ly/49XiqIB
#dataviz #stats #analytics #datascience
